Real-time rendering, adaptive pipelines, connected data & visualization
Turning Complex Product Flows into Intuitive Insight For this project, our engineering team set out to make 3D data explorationas natural and fluid as navigating Google Maps.
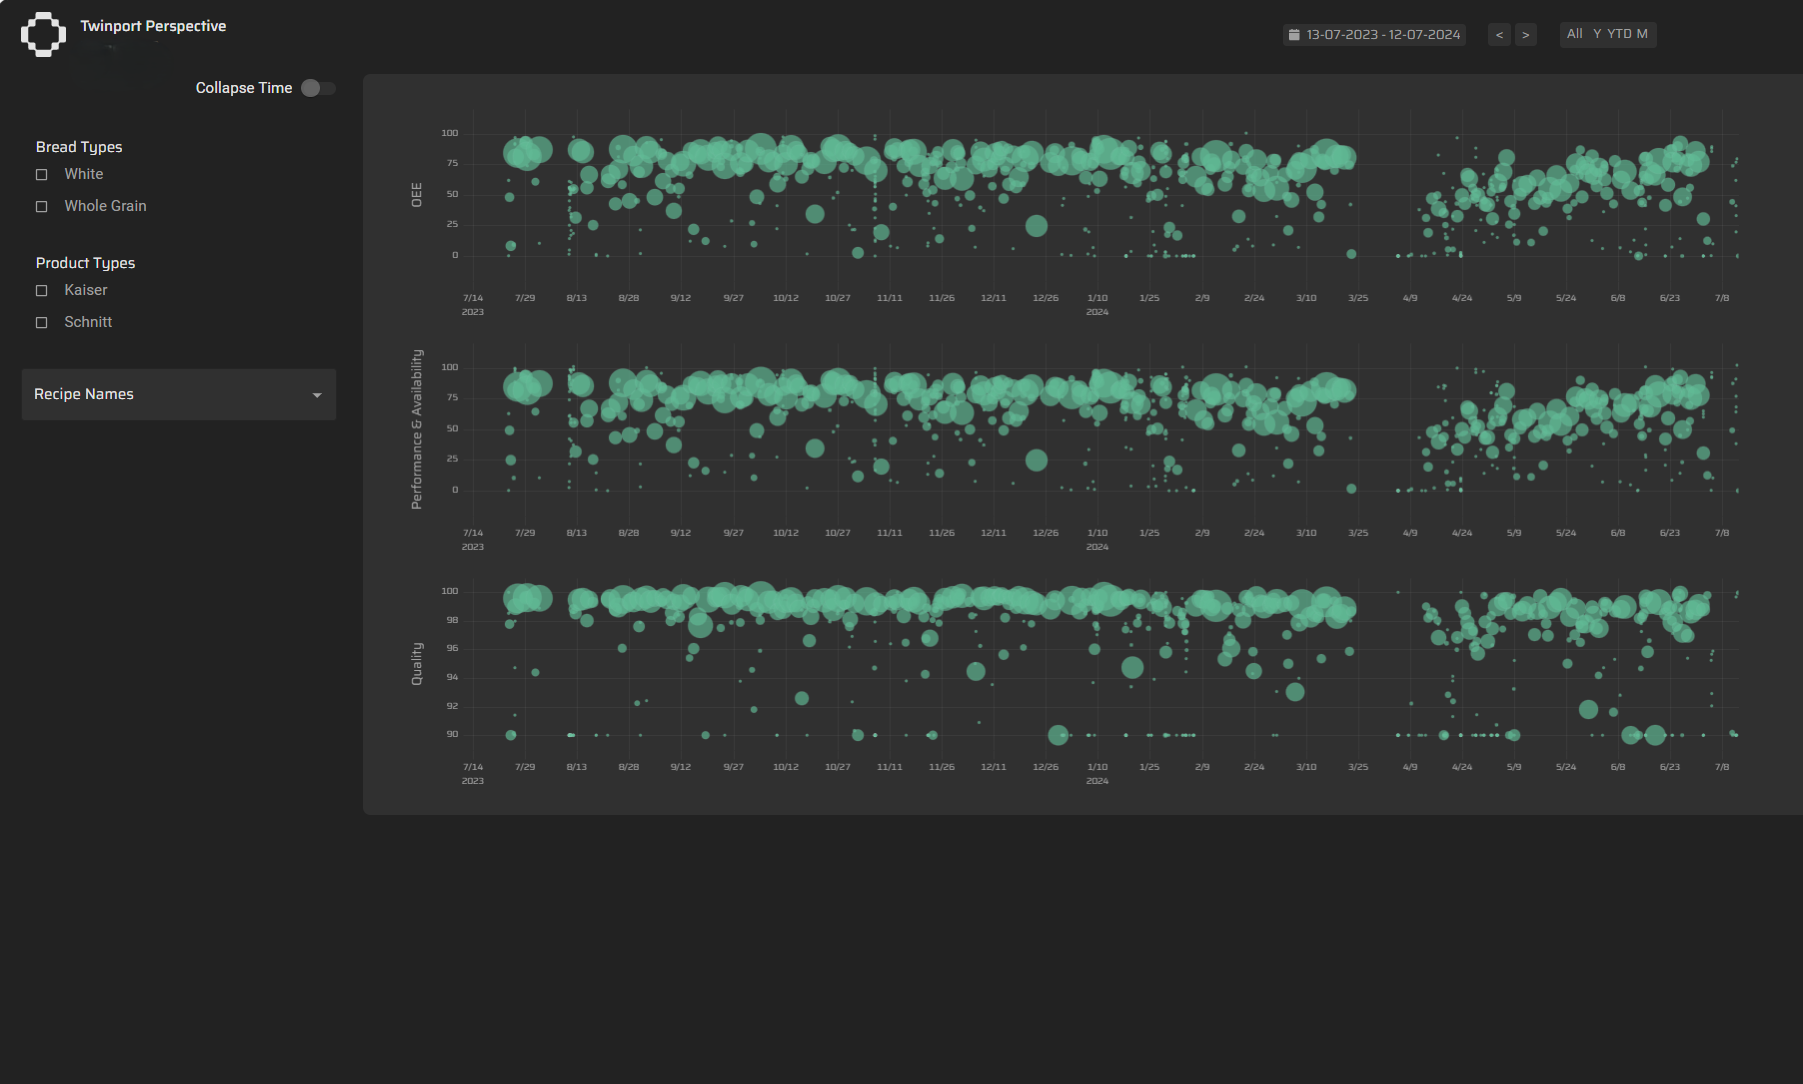
The result is a powerful 3Ddata analytics and visualization platform that lets users move effortlessly from the big picture down to every individual product in a batch — with all measurements, statistics, and 3D features available at a glance.
With just a few clicks, users can explore complete quality-control batches, dive into specific product streams, and visualize the exact geometry andinspection results of each object. The interface is fast, responsive, and remarkably intuitive — designed to make even the most complex datasets easy to work with.
Designed for Performance and Clarity Every detail of the user experience has been carefully crafted. From thereal-time rendering engine to the adaptive data pipelines, the platform responds instantly and keeps the user immersed in their analysis. This seamless connection between data and visualization bridges the gap between engineering insight and operational decision-making.
From Twinport 360 to a New Dimension The project evolved from TWINport360, a spin-out from SINGA, specialized in 3D digitization of product flows. Where TWINport360 focuses on capturing the physical reality of products in high resolution, this new platform takes the next step — transforming 3D data into actionable intelligence through visualization, analytics, and design.
Grow your business.
Discover how SINGA can empower your organization and unlock new possibilities.